Jet Reports – reporting tool in Excel for Business Central

Reporting in Dynamics Business Central has never been easier by using Jet Reports. The tool has more than 70 predefined reports, which can be used as such or with minimal customization. Moreover, you can create easily reports without programming knowledge, just using a ”drag & drop” interface in Excel – a familiar application to many of us.

In this way you have at your disposal reports who ca be updated quickly, being directly connected to the database. Thus you can spend time analyzing data, and not creating them. You can create ad-hoc analysis and key performance indicators, and you have the capability to access from Excel, using a ”drill down” function, the raw data from Business Central.

Jet Reports is available in several editions, according to the reporting needs of each company, and the size of the data to be reported.

See below more about Jet Reports editions:

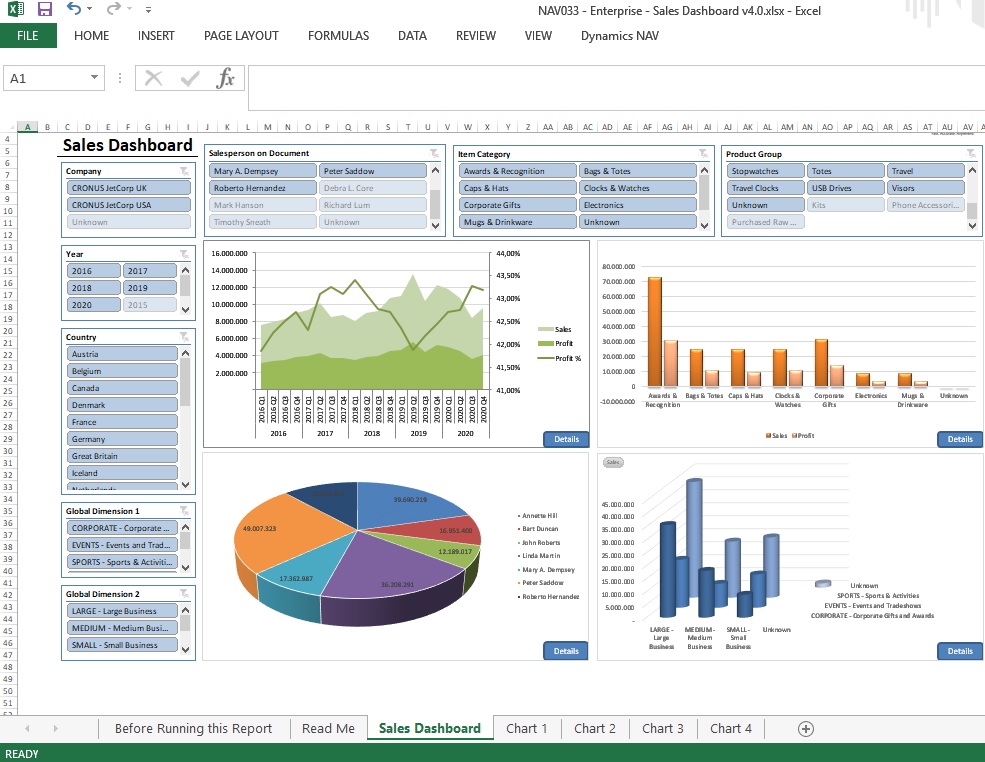
JetReports_Business Central_Sales_Dashbord

Jet Analytics – a complete Business Intelligence solution

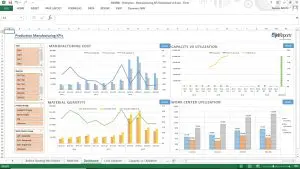
JetReports_Business_Central_KPI_ManufacturingJet Analytics helps you get the answers to your mission critical questions inside an application that you already know – Excel.

With little or no training you can quickly analyze issues from many different perspectives to discover trends in your business.

Jet Analytics provides the strategic information you need to identify opportunities and proactively detect issues before they escalate.

Jet Analytics provides six pre-defined OLAP cubes designed specifically for Dynamics Business Central database. These cubes include a comprehensive set of dimensions and measures to provide lightning fast and flexible views of:

  • Finance
  • Sales
  • Purchase
  • Accounts Receivables
  • Accounts Payables
  • Inventory

With Jet Analytics you can monitor key indicators across multiple companies and currencies, spot trends and changes in your customers’ buying patterns, identify which products, categories or groups are generating the highest gross margin, identify which customers have the highest (or lowest) sales, gross margin amount or gross margin percentage, optimize inventory levels by analyzing inventory turns, quantity and values … and many more.

Jet Analytics complements Jet Reports to provide a complete solution to your business information needs:

  • Strategic and tactical ad hoc analyses
  • Organizational dashboards
  • Reports can be automatically distributed on daily, weekly or monthly basis

Jet Reports is Complete Reporting inside Excel

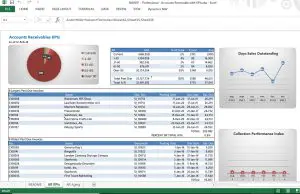
Jet-Report-Business_Central-AR-KPIJet Reports offers you the total control of report formatting and design, with no need for programming knowledge.

Get answers and format business information using all the powerful Excel features you already know.
Have Excel reports refresh with just one click, with the latest real-time information from your database.
Organize, display and launch reports from your desktop with our free Report Player.
Schedule reports to run without user assistance and receive automatically Excel or PDF reports in your e-mail.

Distinctive…

  • It’s all Excel.
  • It’s all your data, even custom fields.
  • Drilldown to see the details.

Painless…

  • Wizards and “Easy Builder” tools step you through to a completed report.
  • Drag and drop information right into Excel.
  • Refresh the data with the click of a button.
  • Scheduler runs reports for you.

Better business insight for your entireJetReports_Navision_Item_Profitability_Customer company

Understanding your business data is an important part of running a successful business. But Business Intelligence applications can be an expensive and complex investment.

With Jet Basics for Business Central you and your employees can get the answers you need to your specific business questions – fast – and create high-impact reports and simple analysis.

Management can:

  • View key performance metrics across all areas of the organization in real time using the Table Builder function.
  • Track consolidated profit and loss by division and company.

Finance can:

  • Detail profit and loss with updates on a daily, monthly or quarterly basis.
  • Stay on top of accounts receivable KPIs in terms of days outstanding, past collection performance and more.
  • Run financial reports from your General Ledger by using the GL function and distribute them on a daily, weekly or monthly basis.

Sales can:

  • Easily build product sheets that pull current pricing and specifications, and instantly update and release important changes.
  • Create a sales dashboard using PowerPivot for Microsoft Excel that tracks sales on a monthly basis, with budget projections for future sales.

Get in touch with an ELIAN consultant